Beer’s share among U.S. drinkers falls to 36%, Gallup finds
The survey found a seven-point decline since 2016, leaving beer only four points ahead of spirits.
2026-08-21
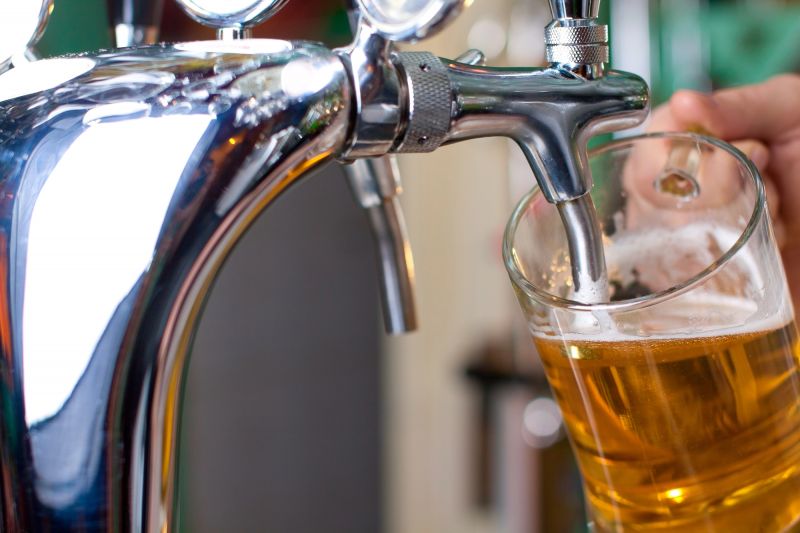
Beer remains the most frequently consumed type of alcohol among U.S. drinkers, but its lead has narrowed sharply over the past decade, according to a Gallup report released Thursday.
Gallup said 36% of Americans who drink alcohol now identify beer as the category they consume most often. That is down seven percentage points from 2016, when roughly 43% gave the same answer. The new figures come from interviews conducted from July 1 through July 19, 2026, and reflect self-reported drinking preferences rather than sales, shipment volumes, or market share.
The decline leaves beer still in first place, but with much less distance from competing categories. Spirits were cited by 32% of drinkers as the alcohol they consume most often, while wine was named by 30%. The gap suggests a more competitive market for consumer preference than a decade ago, when beer held a clearer lead.
Gallup published the figures in its report, “Americans’ Drinking Remains at Record Low,” dated Aug. 20. The preference data point to a long-term shift in the drinking habits Americans report, especially as distilled spirits continue to gain ground. The survey does not measure how much people drink, how often they buy alcohol, or how much money they spend. It records which category drinkers say they consume most often.
The gender split in the new survey was wide. Among male drinkers, 56% said beer is the alcoholic beverage they drink most often. Among female drinkers, just 16% said the same. That difference helps explain why beer retains the top spot overall even as its broad national standing has weakened. The data also show that beer’s base remains concentrated more heavily among men than among women.
The numbers add to evidence of a structural change in stated preference that has unfolded over several years. Beer’s position has not collapsed, but the seven-point drop since 2016 is large enough to show a clear erosion in the category’s hold on drinkers. At the same time, spirits have moved closer to beer, reducing what was once a larger advantage.
Because the Gallup measure is based on self-description, it should not be read as a direct indicator of retail performance. A respondent who says beer is what they drink most often may consume small quantities, while a respondent who prefers wine or spirits may spend more or drink more frequently. The survey also does not break out spending patterns, brand choice, or differences between on-premise and off-premise consumption. Its value is in tracking preference over time through a consistent question.
Even with those limits, the trend is notable because it shows change in the category Americans identify with most. Beer has long occupied a central place in U.S. drinking culture, and it still leads both wine and spirits in Gallup’s latest measure. But the data suggest that lead is no longer as secure as it was 10 years ago.
The movement is especially significant because it comes during a period when overall drinking in the United States remains historically subdued by Gallup’s measure. In that setting, shifts within the drinking population can matter more. If fewer Americans are drinking at all, then changes in the preferences of those who do drink may carry added weight for producers, distributors, and retailers trying to understand where consumer interest is moving.
Gallup’s wording also matters. The survey asked people who drink alcohol to identify the kind they drink most often. That is different from asking which category they like best, purchase most often, or consume in the largest volume. It is also different from industry tracking based on cases sold, tax receipts, restaurant orders, or wholesale shipments. The result offers a view into declared habit rather than measured commercial activity.
Still, the direction of change is clear in the survey results. Beer’s share of stated preference has moved down since 2016, while spirits have gained enough ground to come within four percentage points of the top category. Wine, at 30%, also remains close enough to keep the three-way split relatively tight compared with earlier years.
The July survey period means the findings capture a recent snapshot of U.S. drinkers’ views during the summer of 2026. Gallup did not present the figure as evidence of a short-term seasonal shift. Instead, the significance lies in the comparison with prior years, particularly 2016, which shows beer losing part of the advantage it once held.
For breweries and the wider alcohol industry, the findings highlight a more fragmented preference landscape. Beer is still the most commonly named category among drinkers, but its dominance is weaker, and the rise of spirits has changed the balance. Gallup’s data do not explain why respondents have shifted, and the report does not attribute the change to one cause. What the numbers show is that the category most often chosen by American drinkers is no longer as far ahead as it once was, and that the change has taken place over a decade rather than in a single year.
