Halloween demand slowed the decline in U.S. beer sales
NielsenIQ said beer dollar sales fell 1.6%; volume dropped 3.3%; softer consumer demand drove 86% of the weakness
Wednesday, November 11, 2026

Views › 183
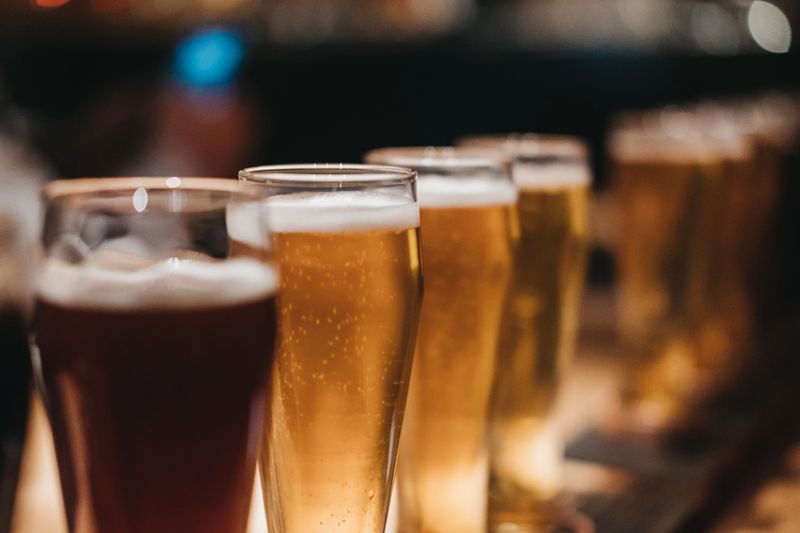
U.S. beer sales showed a smaller decline in the four weeks ending Oct. 31, with Halloween demand helping lift weekly results even as the broader category remained under pressure, according to a NielsenIQ report on retail sales.
NielsenIQ said dollar sales for total beer, excluding flavored malt beverages and hard seltzer, fell 1.6% from a year earlier during the period, while volume was down 3.3%. Both measures improved from the prior reporting period, suggesting the pace of the category’s decline eased as seasonal buying picked up late in October.
The report said weaker consumer interest remained the main reason for lower sales. NielsenIQ attributed 86% of the decline to softer demand from shoppers, while 13% came from distribution losses. On a week-to-week basis, dollar sales reached $870.8 million, up 2.5% from the previous week, as Halloween-related purchases added momentum.
The October report pointed to an uneven market in which some higher-growth and premium segments continued to offset part of the weakness in more traditional parts of the beer business. Import beer returned to dollar growth, rising 0.3%, while its volume decline narrowed to 1.5%. Domestic super premium also posted gains, with dollar sales up 2.3% and volume up 1.6%.
Other areas outperformed the broader category by a wide margin. Cider sales rose 6.5% in dollars and 4.9% in cases, while non-alcoholic beer increased 8.9% in value and 7.5% in volume. Those results added to signs that consumers are still spending in select niches, even as overall beer demand remains softer than a year ago.
At the same time, the category’s weakest large segments continued to post notable declines. Domestic premium beer fell 5.5% in dollar sales and 6.8% in volume, making it the weakest major segment in NielsenIQ’s breakdown. Craft beer also declined, with dollar sales down 4.1% and volume off 5.6%.
Among manufacturers, Anheuser-Busch remained the largest by dollar sales, even though its sales fell 1.9% and its case volume dropped by 1.7 million. Constellation ranked second and was one of the largest companies to post growth, with dollar sales up 1.8% and case volume up 58,700. Molson Coors Beverage Co. held the third spot, but its dollar sales declined 3.6% and its case volume fell by 1.3 million.
Heineken USA ranked fourth and posted a 6.5% drop in dollar sales, along with a decline of 338,400 cases. New Belgium Brewing ranked fifth by dollar sales and stood out as a growth company, with sales up 6.7% and case volume up 48,900.
When ranked by dollar growth, Constellation led the major manufacturers tracked in the report, followed by New Belgium Brewing, Boston Beer, Sapporo Breweries Ltd. and Athletic Brewing Co. Sapporo posted the fastest dollar growth among that group at 15.6%, while Athletic Brewing continued to benefit from demand in non-alcoholic beer with a 3.6% increase.
At the brand level, Modelo remained the top beer brand by dollar sales. Its dollar sales rose 0.8%, although case volume fell by 130,500. Budweiser ranked second, but its dollar sales declined 7.4% and its case volume dropped by 1.6 million, making it one of the steepest declines among the leading brands.
Michelob ranked third by dollar sales and delivered the strongest growth among the top five brands, with dollar sales up 5.3% and case volume up 462,200. Corona ranked fourth, with dollar sales down 1.5% and case volume down 185,400. Coors rounded out the top five, with dollar sales down 1.9% and case volume down 429,000.
Among brands ranked by dollar growth, Michelob led the list, followed by Pacifico, Busch, Victoria and Modelo. Pacifico posted a 20.5% gain in dollar sales and added 282,600 cases, while Victoria rose 18.7% and gained 83,000 cases. Busch increased 3.0% in dollar sales and added 130,100 cases.
The report suggests the U.S. beer market entered November with better short-term momentum than it showed earlier in the fall, helped by seasonal buying around Halloween. But the category as a whole remained in decline through Oct. 31, with NielsenIQ’s data showing that weaker consumer demand, more than distribution changes, continued to weigh on sales.