U.S. wine sales fell 3.8% by value, 5.3% by volume in the four weeks ended Oct. 31
Still wine led the decline, leaving gains in sparkling wine and non-alcoholic wine too small to lift the market
Wednesday, November 11, 2026

Views › 539
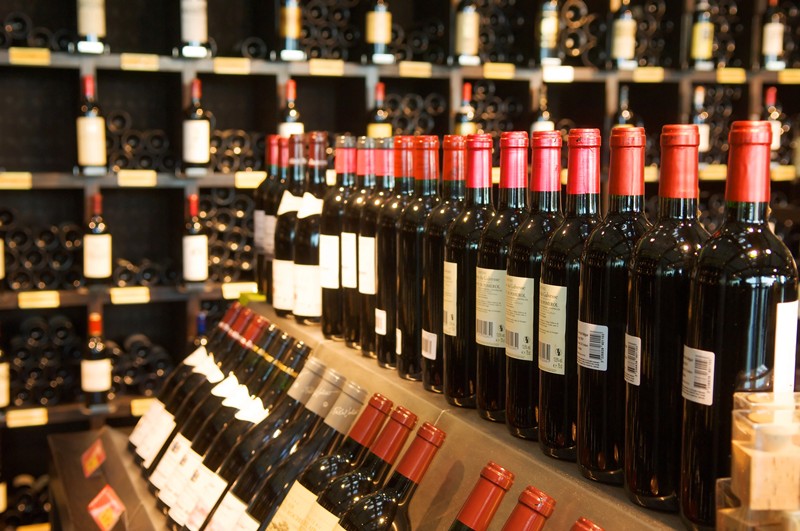
U.S. wine sales fell in both dollar value and volume in the four weeks ended October 31, even as sparkling wine and non-alcoholic wine posted gains, according to NielsenIQ retail panel data released on Tuesday, November 10.
The data showed total wine sales, excluding wine-based cocktails, declined 3.8% in value and 5.3% in volume from the comparable four-week period in 2025. The figures point to continued weakness in the broader market, with growth in smaller segments failing to offset the decline in traditional still wine.
Still wine remained the main drag on the category. Sales in that segment fell 4.7% in value and 5.9% in volume from a year earlier. That decline was steeper than the drop for the market as a whole and underscores how much of the pressure remains concentrated in the core part of the business.
By contrast, sparkling wine continued to grow, though at a modest pace. NielsenIQ reported a 2.2% increase in value and a 0.9% rise in volume for sparkling wines over the same period. Non-alcoholic wine posted the strongest gains among the segments listed, with value up 19.3% and volume up 15.3%.
Those increases show that some parts of the market are still attracting buyers, but the gains were not large enough to reverse the overall decline. The data suggest consumers are still pulling back more sharply from conventional table wine than they are from smaller, more specialized categories.
The report also included a short-term improvement in weekly sales. In the week ended October 31, wine sales totaled $381.3 million, up 2.3% from the week ended October 24. But that weekly increase does not show a broader recovery on its own. The four-week figures remained below the comparable period in 2025, and the report did not provide the absolute sales levels needed to calculate the year-over-year gap in dollars or cases across the full four-week period.
The difference between the decline in value and the steeper decline in volume is also significant. Because dollar sales were measured in nominal terms, the smaller drop in value than in volume suggests that pricing, product mix, or both helped cushion the fall in revenue. In simple terms, fewer cases were sold, but the average dollars generated per unit sold held up better than volumes did.
The figures were published in a report reproduced by Wine Industry Advisor and attributed to NielsenIQ’s wine tracking data. The underlying measure covers retail sales captured by the panel, not total national wine consumption. That means the results should be read as a snapshot of the retail channels included in NielsenIQ’s sample rather than a complete picture of all wine sold or consumed in the United States.
The reporting period also matters. The four weeks ended October 31 do not match the natural month of October, so the numbers are best compared with the same four-week window in 2025 rather than with monthly calendar data from other sources. NielsenIQ’s measure also excludes wine cocktails, which means the figures reflect wine sales more narrowly defined and do not include all wine-adjacent alcoholic products competing for consumer spending.
For producers, importers and retailers, the split inside the category is likely to draw attention. Sparkling wine and non-alcoholic wine continued to expand, but the overall market stayed under pressure because still wine, the largest segment, kept losing ground in both dollars and cases.