Chile’s bottled wine exports fell 5.2% in the first nine months of 2026
A 27.7% drop in sales to the United States erased gains in Brazil and the United Kingdom, leaving revenue at $902.7 million
Tuesday, November 3, 2026
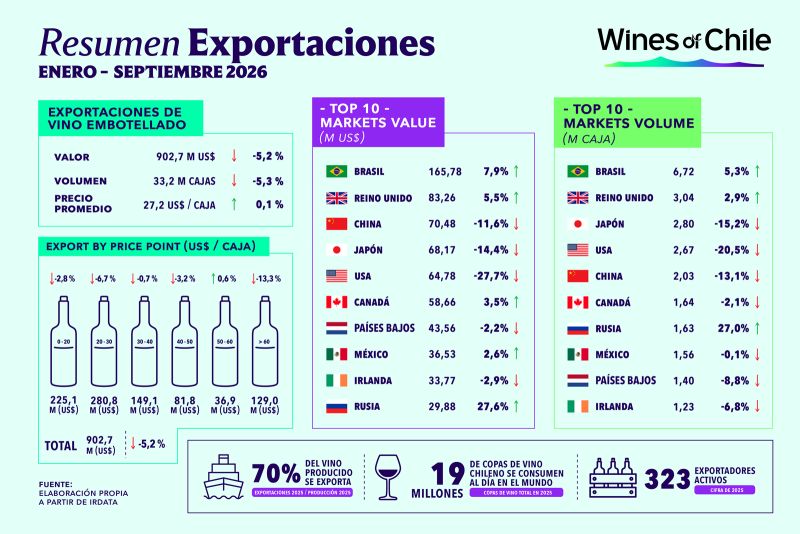
Chile’s bottled wine exports fell in the first nine months of 2026 as lower sales volumes outweighed flat pricing, according to Vinos de Chile’s September export report based on IRDATA data.
The industry shipped $902.7 million in bottled wine between January and September, down 5.2% from the same period in 2025. Export volume fell 5.3% to 33.2 million cases, while the average price was nearly unchanged, rising 0.1% to $27.2 per case.
The figures point to a loss of about $49.5 million in export revenue and roughly 1.86 million cases compared with January through September 2025, based on calculations from the published rates of change. The decline was not spread evenly across markets. Stronger demand in Brazil and the United Kingdom helped limit the drop, but those gains were outweighed by a sharp setback in the United States and weaker business in parts of Asia.
Vinos de Chile’s broader industry data shows how important foreign markets are for the country’s wine sector. An infographic included with the report said exports were equal to 70% of wine production in 2025, when Chile had 323 active exporters. It also estimated that 19 million glasses of Chilean wine were consumed around the world each day in 2025. Those figures refer to the full Chilean wine industry, while the January-to-September 2026 trade results cover bottled wine only.
Among the top 10 export destinations, the United States posted the steepest deterioration. Sales to that market fell 27.7% to $64.78 million, while shipments dropped 20.5% to 2.67 million cases. That means wineries not only sold less wine in the United States, but also received less money per case on average. Based on the published value and volume changes, revenue per case in that market fell by about 9.1% to roughly $24.3.
The loss in the United States was especially important because it accounted for about half of Chile’s net decline in bottled wine export revenue. Based on the reported rate of decline, the drop in sales to the United States was close to $24.8 million. The market ranked fifth by value and fourth by volume among Chile’s destinations in the report, but its contraction had an outsized effect on the national total.
China and Japan also weighed on the results. China was Chile’s third-largest bottled wine market by value, with sales of $70.48 million, down 11.6%. Shipments to China fell 13.1% to 2.03 million cases, leaving the market fifth by volume. Because volume fell more than revenue, the average return per case rose slightly, by about 1.7%, to around $34.7.
Japan ranked third by volume and fourth by value. It bought 2.8 million cases, down 15.2%, for $68.17 million, down 14.4%. As in China, the decline in quantity was steeper than the decline in value, suggesting that the average revenue per case held up somewhat better than shipment levels. Based on the reported changes, Chile lost about $9.2 million in China and about $11.5 million in Japan. Combined with the decline in the United States, those three markets accounted for roughly $45.5 million in lost revenue before gains and losses in other destinations are considered.
Brazil remained Chile’s largest buyer and provided the biggest positive contribution. Exports to Brazil rose 7.9% to $165.78 million, while volume increased 5.3% to 6.72 million cases. Brazil represented 18.4% of export revenue and 20.2% of exported volume in the January-to-September period. The increase added about $12.1 million in revenue from a year earlier, the largest absolute gain among the 10 markets listed in the report.
The Brazilian market grew through both higher volume and a better average return per case. Based on the reported changes, revenue per case rose about 2.5%, although the average price, at roughly $24.7 per case, remained below Chile’s overall average of $27.2. That suggests Brazil’s importance came mainly from its scale and steady expansion rather than from premium pricing.
The United Kingdom also supported export earnings. It held the second position by both value and volume, with shipments rising 2.9% to 3.04 million cases and revenue climbing 5.5% to $83.26 million. That increase was worth about $4.3 million from the same period in 2025. Together, Brazil and the United Kingdom accounted for $249.04 million, or 27.6% of Chile’s bottled wine export value. Even so, the combined gain from those two markets, at about $16.5 million, did not offset the loss in the United States alone.
Some markets improved revenue despite taking fewer cases. Canada bought 1.64 million cases, down 2.1%, but spending rose 3.5% to $58.66 million. That implies an increase of about 5.7% in average revenue per case, putting Canada at roughly $35.8 per case, the highest among the 10 destinations in the report. Mexico showed a similar pattern. Revenue rose 2.6% to $36.53 million even as volume edged down 0.1% to 1.56 million cases. The average return per case there increased by about 2.7%.
Russia posted the fastest growth rate among the top 10 markets, though from a smaller base. Sales rose 27.6% to $29.88 million and shipments increased 27% to 1.63 million cases. That added about $6.5 million in revenue. Most of the increase appears to have come from higher volume rather than pricing. At about $18.3 per case, Russia had the lowest average return among the markets listed, which helps explain why it ranked seventh by volume but 10th by value.
In the Netherlands and Ireland, revenue fell less than volume, indicating some improvement in the value mix. The Netherlands bought 1.4 million cases, down 8.8%, for $43.56 million, down 2.2%. Ireland imported 1.23 million cases, down 6.8%, for $33.77 million, down 2.9%. Based on those changes, average revenue per case improved by about 7.2% in the Netherlands and 4.2% in Ireland, though not enough to prevent lower total sales.
The top 10 destinations together generated $654.87 million in sales and 24.72 million cases, equal to 72.5% of Chile’s bottled wine export value and 74.5% of its volume. Five of those markets increased spending, but only three — Brazil, the United Kingdom and Russia — also increased shipments. That split shows that in several places exporters were able to improve revenue per case even as physical volumes weakened.
The pressure was also visible in the industry’s price segments. Bottled wines priced above $60 per case brought in $129 million, down 13.3%, the steepest percentage decline among the six price bands in the report. That segment accounted for 14.3% of total revenue, but its drop represented roughly $19.8 million, or about 40% of the overall decline in bottled wine export earnings.
The largest sales band, wines priced between $20 and $30 per case, also posted a significant decline. Revenue in that range fell 6.7% to $280.8 million, or 31.1% of the total. That was a decrease of about $20.2 million. Taken together, the $20-to-$30 category and the over-$60 category lost close to $40 million, or about 81% of the net decline in export revenue.
Wines priced at up to $20 per case generated $225.1 million, down 2.8%. Combined with the $20-to-$30 segment, those lower-priced categories represented $505.9 million, or 56% of total bottled wine export sales. In the midrange, wines priced at $30 to $40 per case slipped 0.7% to $149.1 million, while the $40-to-$50 category fell 3.2% to $81.8 million.
The only price band to post higher revenue was $50 to $60 per case. Sales in that category rose 0.6% to $36.9 million. It was also the smallest of the six published segments, accounting for 4.1% of total export revenue. The increase was modest, about $220,000 compared with January through September 2025, and stood in sharp contrast to the multimillion-dollar declines in the industry’s largest and highest-priced segments.